| METHOD | UT | ADVANTAGES | DISADVANTAGES | DIAGRAM | |
|---|---|---|---|---|---|
| 1 | Sidewalks | +5 | Gives pedestrians their own space | Need more right-of-way | |
| 2 | Street Trees | −2 | Can protect pedestrians from cars | Can hide pedestrians & bicycles from cars Roots can destroy pavement | |
| 3 | Roundabouts | +4 | Much safer for vehicles & pedestrians | Much more space than normal intersection Must pass all truck traffic | |
| 4 | Narrower streets | −1 | Slows traffic by reducing maneuver space | Must pass large trucks & fire equipment Not suitable for major arterials | |
| 5 | Speed bumps & humps | −4 | Slows traffic with vertical deviations Inexpensive |
Painful to passengers with back trouble
Can damage bumpers & fenders of some cars High-centers large truck frame resting on hump | |
| 6 | Chicanes | 0 | Slows traffic with horizontal deviations | Not suitable for major arterials | |
| 7 | Bulb-outs | +1 | Shorter pedestrian crossing distance | Can keep trucks from turning at intersection | |
| 8 | Center medians | +3 | Pedestrians cross fewer lanes at a time Opposite directions stop at different times Works with flashing pedestrian beacon Pedestrians cross opposite directions of traffic at different times. |
Slightly wider street | 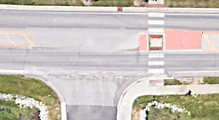 |
| 9 | Reduced speed limit | −3 | Reduces collision speed Increases maneuvering time |
Reduces fuel mileage of vehicles (see below)
Some drivers go design speed of road | |
| METHOD | UT | ADVANTAGES | DISADVANTAGES | DIAGRAM | |
| 10 | Neckdowns | −1 | Only one traffic direction moves at a time | Suitable for only very minor streets | |
| 11 | Overdesign at 40 mph Sign at 30 mph | −2 | Feels safer | Drivers feel higher design speed & drive it Causes some speeding | |
| 12 | Prohibiting all turns on red | +1 | Reduces conflicts at intersection | Reduces fuel mileage of vehicles (see below) | |
| 13 | Reduced corner curb radii | −2 | Shorter paths for pedestrians to cross | Some vehicles must back up to make the turn | |
| 14 | Isolated Pedestrian Hybrid Beacon | 0 | Stops traffic for pedestrians | Stops traffic too long (25 s) for one pedestrian Pedestrians often cross before walk signal |
 |
| 15 | Intersection Pedestrian Hybrid Beacon | −5 | Stops some traffic (not all) for pedestrians | Stops traffic too long (25 s) for one pedestrian Does not stop cross traffic Pedestrians often cross before walk signal Does not conform to Manual on Uniform Traffic Control Devices | |
| 16 | Flashing Pedestrian Beacon | +5 | Causes minimal interruption of traffic Works well with center median or island |
None |  |
| 17 | Removing view blockers | +2 | Remove brush, parking, and signs to fix | Might cause owner complaints | |
| 18 | Pedestrians: educate and enforce | +3 | Knowing signal sequences helps pedestrians Pedestrians think their light is next Button does not change signal phase order |
Pedestrians do what they can to save time Pedestrians often don't wait for traffic signals Enforcement costs money | |
| 19 | Bicycles: educate and enforce | +1 | Knowing signal sequences helps cyclists Cyclists think their light is next Cyclists need to learn wrong-lane hazards |
Cyclists do anything to reduce pedaling effort Cyclists often disobey stop signs and signals Cyclists hate extra blocks for one-way streets Enforcement costs money | |
| 20 | Motorists: educate and enforce | +4 | Motorists need to learn patience | Motorists do what they can to hurry Sometimes they break the law to do so | |
| METHOD | UT | ADVANTAGES | DISADVANTAGES | DIAGRAM | |
| 21 | Pedestrian & bicycle overpasses | +1 | Free-flow crossings No possibility of collision with a car |
Expense of construction and maintenance Some cross at the street to avoid steep ramps | |
| 22 | Require business signs placed at ground level | −5 | Pleases Democrat aesthetics | Hides cars, bicycles, & pedestrians from others Hides driveways from streets | |
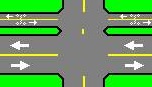
| 23 | Two-way bicycle sidepath on one side of street | −5 | Lowest cost for separate sidepaths |
Too many conflicts at each intersection Reduced visibility of conflicting traffic |
 |
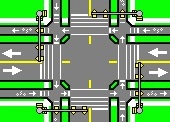
| 24 | One-way bicycle sidepath on each side of street | +4 | Minimizes conflicts with bikes Increased visibility of conflicting traffic This is also called "Complete Street" |
Costs more to build. Needs more right-of-way |
 |
| 25 | Right turn signal if right turn lane and cross left signal | +3 | Many right turns happen on Don't Walk Fewer rights during pedestrian Walk |
Costs more to install | |
| 26 | Left and right turns have their own signal phases | +2 | Crossing movements never cross paths No lefts or rights during pedestrian walk |
Passes less traffic than other methods Needs left and right turn lanes |


|
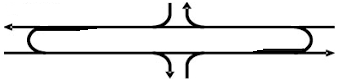
| 27 | J-turn intersection | +4 | Fewer movements at intersection Pedestrians cross fewer lanes Cross only one movement at a time |
Higher costs to build Much more right-of-way needed |
 |
| 28 | Recall pedestrian phase | −2 | Keeps signals in progression Walkers don't have to push buttons |
Wastes fuel while vehicle stopped |